Dump truck insurance can cost $400–$1,200+/mo. See cost drivers, budgeting tips, quote checklist, and savings.

If you’re asking how much is insurance for a dump truck, a realistic 2026 budget for many owner-operators is $400–$1,200+ per month per truck (about $4,800–$14,400+ per year). That range swings because dump work is rated as vocational trucking: heavy payloads, tight jobsites, frequent backing, and higher rollover exposure.
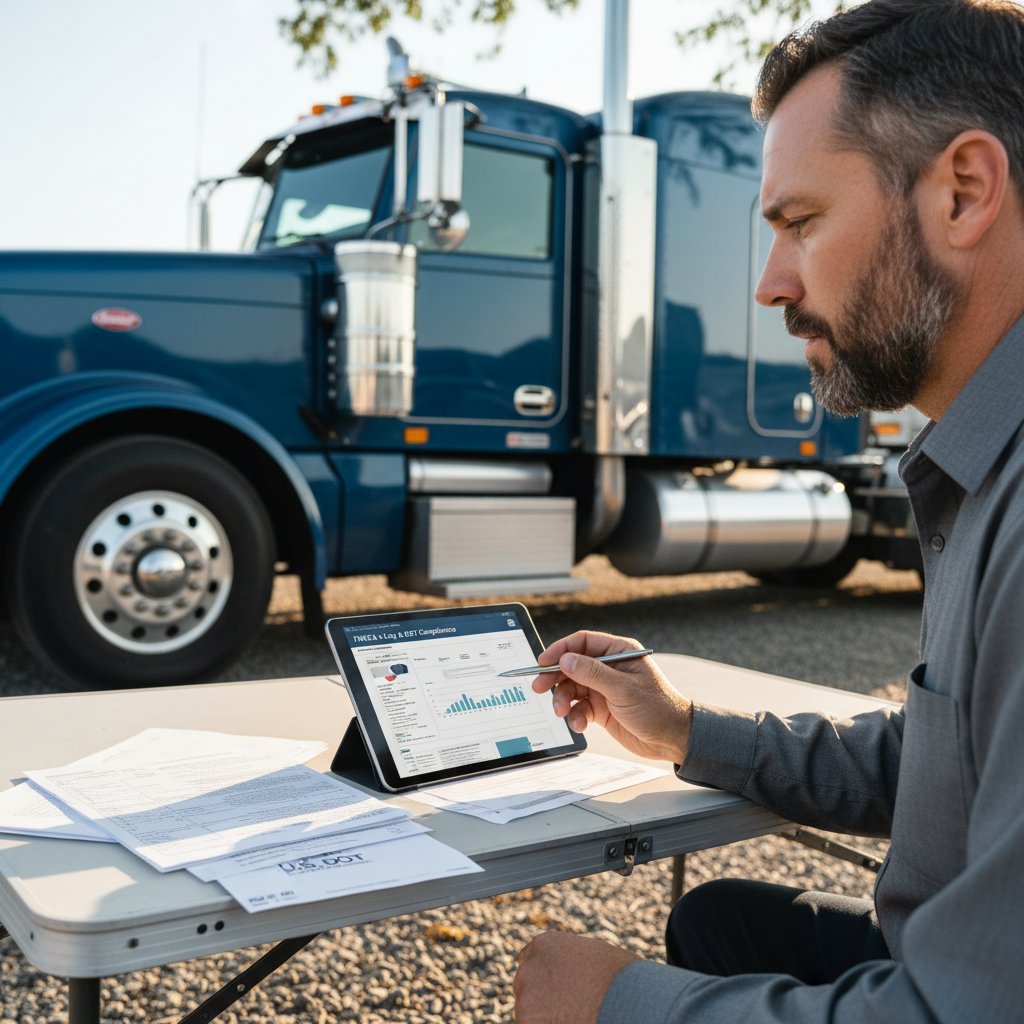
Before you shop, get your info in order so quotes don’t come back “all over the place.” This quick prep guide helps you gather the basics carriers underwrite: dump truck insurance cost checklist.
Table of Contents
Reading time: 8 minutes
- Key takeaways (fast budgeting)
- Average dump truck insurance cost (monthly + annual ranges)
- What coverages make up dump truck insurance (and what each adds to cost)
- How to lower dump truck insurance premiums (without getting underinsured)
- Frequently Asked Questions
- Conclusion: What to budget and how to get an accurate quote
Key takeaways (fast budgeting)
In 2026, many dump truck owner-operators budget $400–$1,200+ per month per truck, with new ventures and quarry/mining exposure often landing above that range.
- Realistic planning range: $400–$1,200+/month is common; metro areas, higher limits, and heavy off-road sites can push $1,600–$2,000+.
- Biggest cost levers: garaging ZIP/state, radius/miles, jobsite type (construction vs quarry/mining), driver MVR/claims, truck value, and liability limits.
- Cheapest can shut down work: being underinsured for a contract (COIs, additional insured, higher limits) can stop you from getting on site.
- Best way to lower cost: compare apples-to-apples quotes with the same limits/deductibles and tighten driver + safety controls.
Average dump truck insurance cost (monthly + annual ranges)
Dump truck insurance is usually priced under the commercial truck insurance umbrella, but vocational dump operations are commonly rated differently than long-haul due to jobsite backing, rollover risk, and frequent short trips.
If you want the bigger framework first (coverages, filings, and how commercial policies are structured), start here: commercial truck insurance basics.
What a “dump truck policy” usually includes
A dump truck insurance setup is typically built around commercial auto liability plus physical damage (comprehensive and collision), with add-ons like general liability, inland marine/equipment, and workers’ comp or occupational accident depending on your contracts and state rules.
Typical 2026 planning range (by operation)
These numbers are budget ranges, not a bindable quote, because underwriting depends on drivers, radius, loss runs, limits, and the work you actually do.
| Operation type | Typical monthly range (per truck) | Typical annual range | Notes |
|---|---|---|---|
| Owner-operator, local (under ~50 miles) | $400–$800 | $4,800–$9,600 | Often lowest exposure if record is clean and work is stable |
| Owner-operator, regional (50–300 miles) | $700–$1,200+ | $8,400–$14,400+ | More miles and more time in traffic increases exposure |
| Small fleet (3–10 trucks) | $600–$1,100+ | $7,200–$13,200+ | Per-truck can improve, but claims can hit harder at renewal |
| New venture / new authority | $900–$1,600+ | $10,800–$19,200+ | New ventures commonly pay a surcharge until history is built |
| Quarry/mining/off-road heavy exposure | $1,000–$2,000+ | $12,000–$24,000+ | Higher severity risk from off-road conditions and heavy payloads |
Sample “rates by state” snapshot (why prices swing)
State pricing can shift quickly due to traffic density, theft trends, weather losses, repair costs, and the local claims/legal environment, so treat this as a starting point only.
| State (sample) | Often seen as… | Illustrative monthly range | Why it moves |
|---|---|---|---|
| TX | Mixed | $500–$1,200+ | Big metro exposure plus long distances |
| FL | Higher | $700–$1,400+ | Dense traffic and higher claim severity trends |
| CA | Higher | $800–$1,700+ | Costly claims and strict market conditions |
| NY/NJ | Higher | $800–$1,800+ | Congestion and higher claim costs |
| PA/OH | Mid | $550–$1,250+ | Industrial hauling and winter losses |
| GA/NC | Mid | $550–$1,300+ | Growing metro congestion |
| IA/NE | Often lower | $450–$1,000+ | More rural territory (operation still matters) |
| VT/ME | Often lower | $400–$950+ | Smaller markets; underwriting appetite varies |
What coverages make up dump truck insurance (and what each adds to cost)
A typical dump truck insurance program combines commercial auto liability (often quoted at $1,000,000 limits for contractor work), physical damage, and optional policies like general liability, inland marine/equipment, and workers’ comp depending on jobsite requirements.
Commercial auto liability (the base premium driver)
Commercial auto liability pays for bodily injury and property damage you cause while operating the truck, and it’s the foundation of most trucking insurance programs.
- Why it moves price: Higher limits generally cost more, and many contractors require $1,000,000.
- Real-world note: A “cheap” liability quote can fall apart if the carrier won’t add jobsite endorsements.
Physical damage (comprehensive + collision)
Physical damage covers theft, weather, vandalism, and crash damage to your truck (minus your deductible), and lenders often require it when the truck is financed.
- Why it moves price: Truck stated value, dump body value, and deductible selection.
- Reality check: One total loss can erase a year of profit if you can’t replace the unit fast.
General liability (GL) for jobsite risk
General liability covers non-auto claims tied to operations (not driving), and construction contracts often require GL plus a COI with additional insured wording.
Inland marine / equipment / tools (often overlooked)
Inland marine (equipment/tools) helps cover scheduled tools and certain job-related equipment that may not be fully covered under auto physical damage.
Workers’ comp or occupational accident (occ-acc)
Workers’ compensation is typically required when you have employees, while occupational accident is sometimes used for owner-operators depending on the state and contract structure.
Legal minimums vs jobsite requirements (don’t confuse the two)
FMCSA financial responsibility requirements and insurance filing rules apply to many interstate operations, and required limits/filings vary by operation and authority type.
For FMCSA’s insurance filing overview, review: https://www.fmcsa.dot.gov/registration/insurance-filing-requirements.

For the paperwork side and how filings like BMC-91/91X can affect start dates, see: DOT insurance filings (BMC-91/91X).
Pro tip: A lot of “insurance problems” are really documentation problems—COIs, additional insured, waiver of subrogation, and primary/noncontributory wording. Bring the contract language to the quote call so you don’t get surprised after you win the job.
If you want the direct quote path tied to this topic, use: Dump Truck Insurance Quote (2026).
Frequently Asked Questions
These FAQs summarize the most common pricing questions owner-operators ask about dump truck insurance cost in 2026.
In 2026, many dump truck owner-operators should budget $400–$1,200+ per month per truck (about $4,800–$14,400+ per year) for a typical liability + physical damage setup. The low end is more common for local radius operations with clean MVRs, prior coverage, and reasonable truck values, while the high end shows up for new ventures, dense metro areas, higher limits, or quarry/mining exposures. For an accurate number, your quote has to match your garaging ZIP, operating radius, job type, truck stated value, and required endorsements.
The biggest dump truck insurance pricing factors are driver MVR/claims history, garaging ZIP/state, operating radius and annual mileage, jobsite exposure (construction vs quarry/mining), truck value, and selected liability limits/deductibles. Dump operations also get hit by frequent “small” losses—backing, mirror strikes, and jobsite property damage—that add up and can drive renewal increases. If you’re trying to control premiums without cutting coverage, start with accurate classification and better loss prevention, then compare quotes with identical limits and deductibles.
Yes—dump truck insurance is commonly rated as vocational trucking with higher jobsite, backing, and rollover exposure, while hotshot insurance is often built around a pickup-and-trailer setup with different weight, handling, and route patterns. Because the risk profile differs, carrier appetite and pricing can be very different even when the policy “looks” similar on paper. If you’re comparing business models or trying to understand why a dump quote came in higher than expected, this breakdown helps: hotshot insurance cost.
Not exactly—while core coverages like liability and physical damage can overlap, dump trucks are typically rated as vocational operations (construction/jobsite exposure), and semi truck insurance is often rated around highway patterns (regional/long-haul mileage, routes, and cargo). That rating difference can change premium, deductibles, and even which carriers will quote. If you’re switching equipment types or adding a unit to your business, it helps to understand those differences: semi truck insurance overview.
Conclusion: What to budget and how to get an accurate quote
For 2026 budgeting, many owner-operators land around $400–$1,200+ per month for dump truck insurance, with new ventures and heavy off-road/quarry exposure often higher.
The fastest way to protect your margin is simple: match limits to your contracts, disclose the real jobsite exposure, and compare quotes with the same limits, deductibles, and endorsements.
Key Takeaways:
- Budget smart: Start with $400–$1,200+/month, then adjust for ZIP, radius, drivers, truck value, and job type.
- Don’t skip contract wording: COIs and endorsements can change price and whether a carrier will even quote.
- Prevent “small” claims: Backing losses and jobsite dings are common renewal killers in vocational trucking.
Before you bind anything, it’s worth a quick read on avoidable errors that trigger cancellations or renewal spikes: Common trucking insurance mistakes.